Calculating Binary Measures
One big disadvantage of Minitab is that, unlike SPSS, it does not provide
Binary similarity measures. However, for a small number of cases it is feasible
to do the calculations by hand.
The key to understanding Binary measures is the matrix of agreement. One
of these must be calculated for each pair of cases and it has four numbers
labelled a, b, c and d where:
You may also need n, the number of variables
For example, using the SAQ data file ( I have re-labelled the variables V1-V5
to avoid confusion with the matrix of agreement names a - d).
Case	V1	V2	V3	V4	V5
1	1	1	1	0	1
2	1	1	1	0	0
3	1	0	0	1	1
4	1	0	1	1	1
5	0	0	1	1	0
In the following examples I have labelled each variable with a, b, c or d
as appropriate.
Case 1 v case 2.
Case	V1	V2	V3	V4	V5
1	1	1	1	0	1
2	1	1	1	0	0
	a	a	a	d	b
Therefore a = 3, b = 1, c = 0, d = 1 and n = 5
Case 2 v case 3
Case	V1	V2	V3	V4	V5
2	1	1	1	0	0
3	1	0	0	1	1
	a	b	b	c	c
Therefore a = 1, b = 2, c = 2, d = 0 and n = 5
Once you have the frequencies for a, b, c and d you substitute them into
the appropriate formula for a distance measure.
The simple matching coefficient is (a + d)/n, therefore
The Dice coefficient is 2a/(2a + b + c), therefore
The Pattern Difference coefficient is bc/(n2), therefore
Calculating and viewing distance matrices in Minitab
Minitab can calculate, store and display distance matrices should you wish
to see them although it is not something that I have ever found particularly
informative. The most important part of a Cluster Analysis, and the only part
that you need for interpretation is the Dendrogram.
However, should you wish to see the distance matrix this is what you need
to do.
These explanations use the SAQ interval variable data. It is assumed that
C1 is Case, C2 is x and C3 is y.
Case	x	y
1 	1 	2
2	3	2
3	6	6
4	10	7
5	8	8
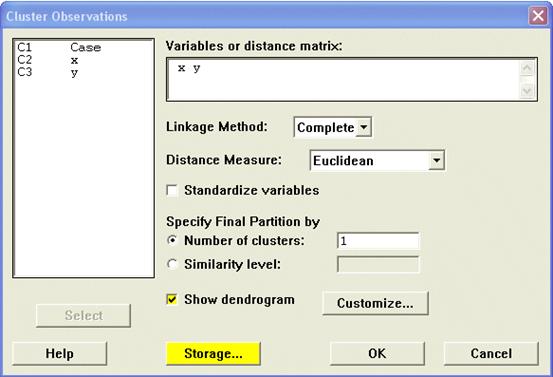
First select the analysis options. In this example the Linkae Method is "Complete"
and the Distance Measure is "Euclidean". Finally, don't forget to
tick the Show Dendrogram option to see the dendrogram!
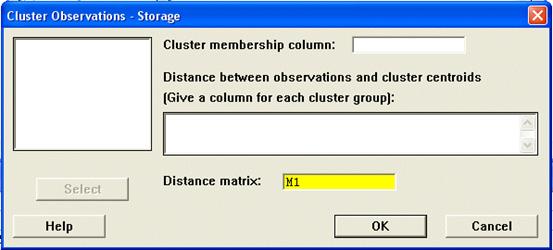
If you wish to store the distance matrix you must click the Storage button
on the Cluster Observations command window. This opens up another window and
you enter a matrix name into the appropriate place (labelled "Distance
Matrix"). Note that matrices have names consisting of the letter M (or
m) followed by a number, e.g. m1, M4, m101, etc. In the following example
I have used the name M1.
Now you need to find a way of displaying the distance matrix. The last command
from the Data menu is "Display Data".
If you select this another window appears and you select M1 as the data you
wish to display.
The output from this command appears in the Minitab Session window.
MTB > Print M1.
Data Display
Matrix M1
 0.000000 2.000000 6.403124 10.295630 9.219544
 2.000000 0.000000 5.000000  8.602325 7.810250
 6.403124 5.000000 0.000000  4.123106 2.828427
10.295630 8.602325 4.123106  0.000000 2.236068
 9.219544 7.810250 2.828427  2.236068 0.000000
MTB >
You can compare this to the results from the SAQ for Euclidean Distances
|
Case
|
1
|
2
|
3
|
4
|
5
|
|
1
|
0.0
|
|
|
|
|
|
2
|
2.0
|
0.0
|
|
|
|
|
3
|
6.4
|
5.0
|
0.0
|
|
|
|
4
|
10.3
|
8.6
|
4.1
|
0.0
|
|
|
5
|
9.2
|
7.8
|
2.8
|
2.2
|
0.0
|